Good Morning,
today i update + rebooted all gluster servers, kernel update to
4.9.0-8 and gluster to 3.12.13. Reboots went fine, but on one of the
gluster servers (gluster13) one of the bricks did come up at the
beginning but then lost connection.
OK:
Status of volume: shared
Gluster process TCP Port RDMA Port Online Pid
------------------------------------------------------------------------------
[...]
Brick gluster11:/gluster/bricksdd1/shared 49155 0
Y 2506
Brick gluster12:/gluster/bricksdd1_new/shared 49155 0
Y 2097
Brick gluster13:/gluster/bricksdd1_new/shared 49155 0
Y 2136
Lost connection:
Brick gluster11:/gluster/bricksdd1/shared 49155 0
Y 2506
Brick gluster12:/gluster/bricksdd1_new/shared 49155 0
Y 2097
Brick gluster13:/gluster/bricksdd1_new/shared N/A N/A
N N/A
gluster volume heal shared info:
Brick gluster13:/gluster/bricksdd1_new/shared
Status: Transport endpoint is not connected
Number of entries: -
reboot was at 06:15:39; brick then worked for a short period, but then
somehow disconnected.
from gluster13:/var/log/glusterfs/glusterd.log:
[2018-08-28 04:27:36.944608] I [MSGID: 106005]
[glusterd-handler.c:6071:__glusterd_brick_rpc_notify] 0-management:
Brick gluster13:/gluster/bricksdd1_new/shared has disconnected from
glusterd.
[2018-08-28 04:28:57.869666] I
[glusterd-utils.c:6056:glusterd_brick_start] 0-management: starting a
fresh brick process for brick /gluster/bricksdd1_new/shared
[2018-08-28 04:35:20.732666] I [MSGID: 106143]
[glusterd-pmap.c:295:pmap_registry_bind] 0-pmap: adding brick
/gluster/bricksdd1_new/shared on port 49157
After 'gluster volume start shared force' (then with new port 49157):
Brick gluster11:/gluster/bricksdd1/shared 49155 0
Y 2506
Brick gluster12:/gluster/bricksdd1_new/shared 49155 0
Y 2097
Brick gluster13:/gluster/bricksdd1_new/shared 49157 0
Y 3994
from /var/log/syslog:
Aug 28 06:27:36 gluster13 gluster-bricksdd1_new-shared[2136]: pending frames:
Aug 28 06:27:36 gluster13 gluster-bricksdd1_new-shared[2136]: frame :
type(0) op(0)
Aug 28 06:27:36 gluster13 gluster-bricksdd1_new-shared[2136]: frame :
type(0) op(0)
Aug 28 06:27:36 gluster13 gluster-bricksdd1_new-shared[2136]:
patchset: git://git.gluster.org/glusterfs.git
Aug 28 06:27:36 gluster13 gluster-bricksdd1_new-shared[2136]: signal
received: 11
Aug 28 06:27:36 gluster13 gluster-bricksdd1_new-shared[2136]: time of crash:
Aug 28 06:27:36 gluster13 gluster-bricksdd1_new-shared[2136]:
2018-08-28 04:27:36
Aug 28 06:27:36 gluster13 gluster-bricksdd1_new-shared[2136]:
configuration details:
Aug 28 06:27:36 gluster13 gluster-bricksdd1_new-shared[2136]: argp 1
Aug 28 06:27:36 gluster13 gluster-bricksdd1_new-shared[2136]: backtrace 1
Aug 28 06:27:36 gluster13 gluster-bricksdd1_new-shared[2136]: dlfcn 1
Aug 28 06:27:36 gluster13 gluster-bricksdd1_new-shared[2136]: libpthread 1
Aug 28 06:27:36 gluster13 gluster-bricksdd1_new-shared[2136]: llistxattr 1
Aug 28 06:27:36 gluster13 gluster-bricksdd1_new-shared[2136]: setfsid 1
Aug 28 06:27:36 gluster13 gluster-bricksdd1_new-shared[2136]: spinlock 1
Aug 28 06:27:36 gluster13 gluster-bricksdd1_new-shared[2136]: epoll.h 1
Aug 28 06:27:36 gluster13 gluster-bricksdd1_new-shared[2136]: xattr.h 1
Aug 28 06:27:36 gluster13 gluster-bricksdd1_new-shared[2136]: st_atim.tv_nsec 1
Aug 28 06:27:36 gluster13 gluster-bricksdd1_new-shared[2136]:
package-string: glusterfs 3.12.13
Aug 28 06:27:36 gluster13 gluster-bricksdd1_new-shared[2136]: ---------
There are some errors+warnings in the shared.log (volume logfile), but
no error message telling me why
gluster13:/gluster/bricksdd1_new/shared has disconnected.
Well... at the moment load is ok, all 3 servers at about 15 (but i
think it will go up when more users will cause more traffic -> more
work on servers), 'gluster volume heal shared info' shows no entries,
status:
Status of volume: shared
Gluster process TCP Port RDMA Port Online Pid
------------------------------------------------------------------------------
Brick gluster11:/gluster/bricksda1/shared 49152 0 Y 2482
Brick gluster12:/gluster/bricksda1/shared 49152 0 Y 2088
Brick gluster13:/gluster/bricksda1/shared 49152 0 Y 2115
Brick gluster11:/gluster/bricksdb1/shared 49153 0 Y 2489
Brick gluster12:/gluster/bricksdb1/shared 49153 0 Y 2094
Brick gluster13:/gluster/bricksdb1/shared 49153 0 Y 2116
Brick gluster11:/gluster/bricksdc1/shared 49154 0 Y 2497
Brick gluster12:/gluster/bricksdc1/shared 49154 0 Y 2095
Brick gluster13:/gluster/bricksdc1/shared 49154 0 Y 2127
Brick gluster11:/gluster/bricksdd1/shared 49155 0 Y 2506
Brick gluster12:/gluster/bricksdd1_new/shared 49155 0
Y 2097
Brick gluster13:/gluster/bricksdd1_new/shared 49157 0
Y 3994
Self-heal Daemon on localhost N/A N/A Y 4868
Self-heal Daemon on gluster12 N/A N/A Y 3813
Self-heal Daemon on gluster11 N/A N/A Y 5762
Task Status of Volume shared
------------------------------------------------------------------------------
There are no active volume tasks
Very strange. Thanks for reading if you've reached this line :-)
Post by Hu BertJust an addition: in general there are no log messages in
/var/log/glusterfs/ (if you don't all 'gluster volume ...'), but on
[2018-08-22 06:20:43.291055] I [socket.c:2474:socket_event_handler]
0-transport: EPOLLERR - disconnecting now
[2018-08-22 06:20:46.291327] I [socket.c:2474:socket_event_handler]
0-transport: EPOLLERR - disconnecting now
[2018-08-22 06:20:49.291575] I [socket.c:2474:socket_event_handler]
0-transport: EPOLLERR - disconnecting now
https://bugzilla.redhat.com/show_bug.cgi?id=1484885 - but that shoud
have been fixed in the 3.12.x release, and network is fine.
+Milind Changire
Post by Hu Bert[2018-08-22 06:19:23.428520] I [cli.c:765:main] 0-cli: Started running
gluster with version 3.12.12
[2018-08-22 06:19:23.800895] I [MSGID: 101190]
[event-epoll.c:613:event_dispatch_epoll_worker] 0-epoll: Started
thread with index 1
[2018-08-22 06:19:23.800978] I [socket.c:2474:socket_event_handler]
0-transport: EPOLLERR - disconnecting now
[2018-08-22 06:19:23.809366] I [input.c:31:cli_batch] 0-: Exiting with: 0
Just wondered if this could related anyhow.
Post by Pranith Kumar KarampuriPost by Hu BertGood morning :-)
ls -l /gluster/bricksdd1/shared/.glusterfs/indices/xattrop/
total 0
---------- 1 root root 0 Aug 14 06:14
xattrop-006b65d8-9e81-4886-b380-89168ea079bd
ls -l /gluster/bricksdd1_new/shared/.glusterfs/indices/xattrop/
total 0
---------- 1 root root 0 Jul 17 11:24
xattrop-c7c6f765-ce17-4361-95fb-2fd7f31c7b82
ls -l /gluster/bricksdd1_new/shared/.glusterfs/indices/xattrop/
total 0
---------- 1 root root 0 Aug 16 07:54
xattrop-16b696a0-4214-4999-b277-0917c76c983e
And here's the output of 'perf ...' which ran almost a minute - file
grew pretty fast to a size of 17 GB and system load went up heavily.
Had to wait a while until load dropped :-)
load gluster11: ~90
load gluster12: ~10
load gluster13: ~50
perf record --call-graph=dwarf -p 7897 -o
/tmp/perf.gluster11.bricksdd1.out
[ perf record: Woken up 9837 times to write data ]
Processed 2137218 events and lost 33446 chunks!
Check IO/CPU overload!
[ perf record: Captured and wrote 16576.374 MB
/tmp/perf.gluster11.bricksdd1.out (2047760 samples) ]
Here's an excerpt.
+ 1.93% 0.00% glusteriotwr0 [unknown] [k]
0xffffffffffffffff
+ 1.89% 0.00% glusteriotwr28 [unknown] [k]
0xffffffffffffffff
+ 1.86% 0.00% glusteriotwr15 [unknown] [k]
0xffffffffffffffff
+ 1.85% 0.00% glusteriotwr63 [unknown] [k]
0xffffffffffffffff
+ 1.83% 0.01% glusteriotwr0 [kernel.kallsyms] [k]
entry_SYSCALL_64_after_swapgs
+ 1.82% 0.00% glusteriotwr38 [unknown] [k]
0xffffffffffffffff
+ 1.82% 0.01% glusteriotwr28 [kernel.kallsyms] [k]
entry_SYSCALL_64_after_swapgs
+ 1.82% 0.00% glusteriotwr0 [kernel.kallsyms] [k] do_syscall_64
+ 1.81% 0.00% glusteriotwr28 [kernel.kallsyms] [k] do_syscall_64
+ 1.81% 0.00% glusteriotwr15 [kernel.kallsyms] [k]
entry_SYSCALL_64_after_swapgs
+ 1.81% 0.00% glusteriotwr36 [unknown] [k]
0xffffffffffffffff
+ 1.80% 0.00% glusteriotwr15 [kernel.kallsyms] [k] do_syscall_64
+ 1.78% 0.01% glusteriotwr63 [kernel.kallsyms] [k]
entry_SYSCALL_64_after_swapgs
+ 1.77% 0.00% glusteriotwr63 [kernel.kallsyms] [k] do_syscall_64
+ 1.75% 0.01% glusteriotwr38 [kernel.kallsyms] [k]
entry_SYSCALL_64_after_swapgs
+ 1.75% 0.00% glusteriotwr38 [kernel.kallsyms] [k] do_syscall_64
+ 1.74% 0.00% glusteriotwr17 [unknown] [k]
0xffffffffffffffff
+ 1.74% 0.00% glusteriotwr44 [unknown] [k]
0xffffffffffffffff
+ 1.73% 0.00% glusteriotwr6 [unknown] [k]
0xffffffffffffffff
+ 1.73% 0.00% glusteriotwr37 [unknown] [k]
0xffffffffffffffff
+ 1.73% 0.01% glusteriotwr36 [kernel.kallsyms] [k]
entry_SYSCALL_64_after_swapgs
+ 1.72% 0.00% glusteriotwr34 [unknown] [k]
0xffffffffffffffff
+ 1.72% 0.00% glusteriotwr36 [kernel.kallsyms] [k] do_syscall_64
+ 1.71% 0.00% glusteriotwr45 [unknown] [k]
0xffffffffffffffff
+ 1.70% 0.00% glusteriotwr7 [unknown] [k]
0xffffffffffffffff
+ 1.68% 0.00% glusteriotwr15 [kernel.kallsyms] [k] sys_getdents
+ 1.68% 0.00% glusteriotwr15 [kernel.kallsyms] [k] filldir
+ 1.68% 0.00% glusteriotwr15 libc-2.24.so [.]
0xffff80c60db8ef2b
+ 1.68% 0.00% glusteriotwr15 libc-2.24.so [.] readdir64
+ 1.68% 0.00% glusteriotwr15 index.so [.]
0xffff80c6192a1888
+ 1.68% 0.00% glusteriotwr15 [kernel.kallsyms] [k] iterate_dir
+ 1.68% 0.00% glusteriotwr15 [kernel.kallsyms] [k]
ext4_htree_fill_tree
+ 1.68% 0.00% glusteriotwr15 [kernel.kallsyms] [k] ext4_readdir
Or do you want to download the file /tmp/perf.gluster11.bricksdd1.out
and examine it yourself? If so i could send you a link.
Thank you! yes a link would be great. I am not as good with kernel side of
things. So I will have to show this information to someone else who knows
these things so expect delay in response.
Post by Hu Bert2018-08-21 7:13 GMT+02:00 Pranith Kumar Karampuri
Post by Pranith Kumar KarampuriOn Tue, Aug 21, 2018 at 10:13 AM Pranith Kumar Karampuri
Post by Pranith Kumar KarampuriPost by Hu BertRegarding hardware the machines are identical. Intel Xeon E5-1650 v3
Hexa-Core; 64 GB DDR4 ECC; Dell PERC H330 8 Port SAS/SATA 12 GBit/s
RAID Controller; operating system running on a raid1, then 4 disks
(JBOD) as bricks.
Ok, i ran perf for a few seconds.
------------------------
perf record --call-graph=dwarf -p 7897 -o
/tmp/perf.gluster11.bricksdd1.out
^C[ perf record: Woken up 378 times to write data ]
Processed 83690 events and lost 96 chunks!
Check IO/CPU overload!
[ perf record: Captured and wrote 423.087 MB
/tmp/perf.gluster11.bricksdd1.out (51744 samples) ]
------------------------
+ 8.10% 0.00% glusteriotwr22 [unknown] [k]
0xffffffffffffffff
+ 8.10% 0.00% glusteriotwr22 [kernel.kallsyms] [k]
iterate_dir
+ 8.10% 0.00% glusteriotwr22 [kernel.kallsyms] [k]
sys_getdents
+ 8.10% 0.00% glusteriotwr22 [kernel.kallsyms] [k] filldir
+ 8.10% 0.00% glusteriotwr22 [kernel.kallsyms] [k]
do_syscall_64
+ 8.10% 0.00% glusteriotwr22 [kernel.kallsyms] [k]
entry_SYSCALL_64_after_swapgs
+ 8.10% 0.00% glusteriotwr22 libc-2.24.so [.]
0xffff80c60db8ef2b
+ 8.10% 0.00% glusteriotwr22 libc-2.24.so [.] readdir64
+ 8.10% 0.00% glusteriotwr22 index.so [.]
0xffff80c6192a1888
+ 8.10% 0.04% glusteriotwr22 [kernel.kallsyms] [k]
ext4_htree_fill_tree
+ 8.10% 0.00% glusteriotwr22 [kernel.kallsyms] [k]
ext4_readdir
+ 7.95% 0.12% glusteriotwr22 [kernel.kallsyms] [k]
htree_dirblock_to_tree
+ 5.78% 0.96% glusteriotwr22 [kernel.kallsyms] [k]
__ext4_read_dirblock
+ 4.80% 0.02% glusteriotwr22 [kernel.kallsyms] [k]
ext4_bread
+ 4.78% 0.04% glusteriotwr22 [kernel.kallsyms] [k]
ext4_getblk
+ 4.72% 0.02% glusteriotwr22 [kernel.kallsyms] [k]
__getblk_gfp
+ 4.57% 0.00% glusteriotwr3 [unknown] [k]
0xffffffffffffffff
+ 4.55% 0.00% glusteriotwr3 [kernel.kallsyms] [k]
do_syscall_64
Do you need different or additional information?
This looks like there are lot of readdirs going on which is different
from
what we observed earlier, how many seconds did you do perf record for?
Will
it be possible for you to do this for some more time? may be a minute?
Just
want to be sure that the data actually represents what we are observing.
I found one code path which on lookup does readdirs. Could you give me
the
output of ls -l <brick-path>/.glusterfs/indices/xattrop on all the three
bricks? It can probably give a correlation to see if it is indeed the same
issue or not.
Post by Pranith Kumar KarampuriPost by Hu Bert2018-08-20 11:20 GMT+02:00 Pranith Kumar Karampuri
Post by Pranith Kumar KarampuriEven the brick which doesn't have high CPU seems to have same number
of
lookups, so that's not it.
Is there any difference at all between the machines which have high
CPU
vs
low CPU?
I think the only other thing I would do is to install perf tools and
try to
figure out the call-graph which is leading to so much CPU
This affects performance of the brick I think, so you may have to do
it
quickly and for less time.
perf record --call-graph=dwarf -p <brick-pid> -o
</path/to/output>
then
perf report -i </path/to/output/given/in/the/previous/command>
Post by Hu Bertgluster volume heal shared info | grep -i number
Number of entries: 0
Number of entries: 0
Number of entries: 0
Number of entries: 0
Number of entries: 0
Number of entries: 0
Number of entries: 0
Number of entries: 0
Number of entries: 0
Number of entries: 0
Number of entries: 0
Number of entries: 0
Looks good to me.
2018-08-20 10:51 GMT+02:00 Pranith Kumar Karampuri
Post by Pranith Kumar KarampuriThere are a lot of Lookup operations in the system. But I am not
able to
find why. Could you check the output of
# gluster volume heal <volname> info | grep -i number
it should print all zeros.
On Fri, Aug 17, 2018 at 1:49 PM Hu Bert
Post by Hu BertI don't know what you exactly mean with workload, but the main
function of the volume is storing (incl. writing, reading)
images
(from hundreds of bytes up to 30 MBs, overall ~7TB). The work
is
done
by apache tomcat servers writing to / reading from the volume.
Besides
images there are some text files and binaries that are stored
on
the
volume and get updated regularly (every x hours); we'll try to
migrate
the latter ones to local storage asap.
Interestingly it's only one process (and its threads) of the
same
brick on 2 of the gluster servers that consumes the CPU.
gluster11: bricksdd1; not healed; full CPU
gluster12: bricksdd1; got healed; normal CPU
gluster13: bricksdd1; got healed; full CPU
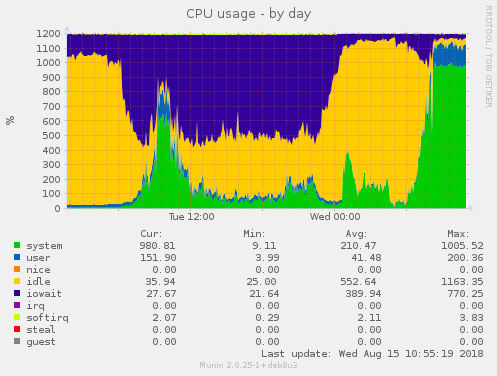
Besides: performance during heal (e.g. gluster12, bricksdd1)
was
way
better than it is now. I've attached 2 pngs showing the
differing
cpu
usage of last week before/after heal.
2018-08-17 9:30 GMT+02:00 Pranith Kumar Karampuri
Post by Pranith Kumar KarampuriThere seems to be too many lookup operations compared to
any
other
operations. What is the workload on the volume?
On Fri, Aug 17, 2018 at 12:47 PM Hu Bert
Post by Hu Berti hope i did get it right.
gluster volume profile shared start
wait 10 minutes
gluster volume profile shared info
gluster volume profile shared stop
If that's ok, i've attached the output of the info
command.
2018-08-17 8:31 GMT+02:00 Pranith Kumar Karampuri
Post by Pranith Kumar KarampuriPlease do volume profile also for around 10 minutes when
CPU%
is
high.
On Fri, Aug 17, 2018 at 11:56 AM Pranith Kumar Karampuri
Post by Pranith Kumar KarampuriAs per the output, all io-threads are using a lot of
CPU.
It
is
better
to
check what the volume profile is to see what is leading
to
so
much
work
for
io-threads. Please follow the documentation at
https://gluster.readthedocs.io/en/latest/Administrator%20Guide/Monitoring%20Workload/
section: "
Running GlusterFS Volume Profile Command"
and attach output of "gluster volume profile info",
On Fri, Aug 17, 2018 at 11:24 AM Hu Bert
Good morning,
i ran the command during 100% CPU usage and attached
the
file.
Hopefully it helps.
2018-08-17 7:33 GMT+02:00 Pranith Kumar Karampuri
Post by Pranith Kumar KarampuriCould you do the following on one of the nodes where
you
are
observing
high
CPU usage and attach that file to this thread? We
can
find
what
threads/processes are leading to high usage. Do this
for
say
10
minutes
when
you see the ~100% CPU.
top -bHd 5 > /tmp/top.${HOSTNAME}.txt
On Wed, Aug 15, 2018 at 2:37 PM Hu Bert
Post by Hu BertHello again :-)
The self heal must have finished as there are no
log
entries
in
glustershd.log files anymore. According to munin
disk
latency
(average
io wait) has gone down to 100 ms, and disk
utilization
has
gone
down
to ~60% - both on all servers and hard disks.
But now system load on 2 servers (which were in the
good
state)
fluctuates between 60 and 100; the server with the
formerly
failed
disk has a load of 20-30.I've uploaded some munin
graphics of
the
cpu
https://abload.de/img/gluster11_cpu31d3a.png
https://abload.de/img/gluster12_cpu8sem7.png
https://abload.de/img/gluster13_cpud7eni.png
This can't be normal. 2 of the servers under heavy
load
and
one
not
that much. Does anyone have an explanation of this
strange
behaviour?
Thx :-)
2018-08-14 9:37 GMT+02:00 Hu Bert
Post by Hu BertHi there,
well, it seems the heal has finally finished.
Couldn't
see/find
any
related log message; is there such a message in a
specific
log
file?
But i see the same behaviour when the last heal
all
CPU
cores are consumed by brick processes; not only
by
the
formerly
failed
bricksdd1, but by all 4 brick processes (and
their
threads).
Load
goes
up to > 100 on the 2 servers with the not-failed
brick,
and
glustershd.log gets filled with a lot of entries.
Load
on
the
server
with the then failed brick not that high, but
still
~60.
Is this behaviour normal? Is there some post-heal
after
a
heal
has
finished?
thx in advance :-)
--
Pranith
--
Pranith
--
Pranith
--
Pranith
--
Pranith
--
Pranith
--
Pranith
--
Pranith
--
Pranith
--
Pranith